Understanding the User Interface
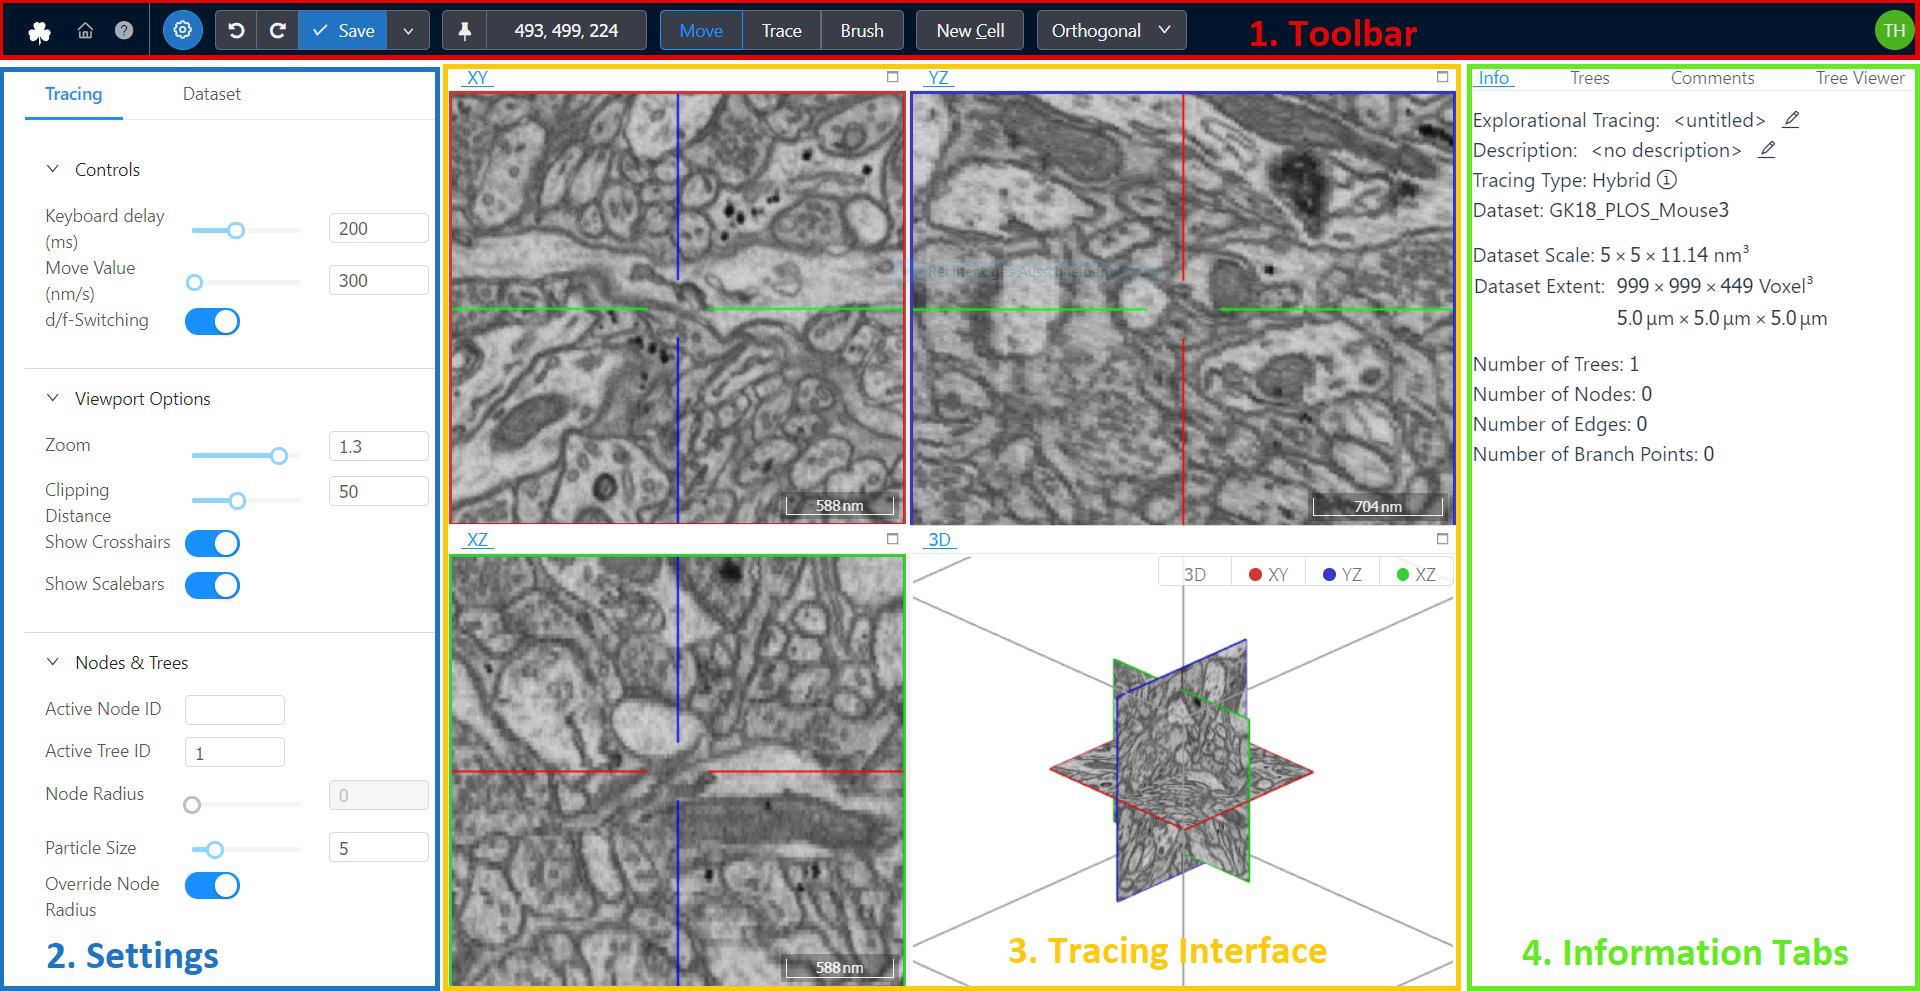
The main webKnossos user interface for viewing and annotating datasets is divided into four sections.
- A toolbar for general purposes features such as Saving your work and displaying the current position within the dataset. It spans along the full width of the top of your screen.
- On the left-hand side, a settings menu gives you control of several parameters of webKosssos. For instance, you can fine-tune a dataset's contrast & segmentation opacity, as well as adjust movement speed of the mouse and keyboard.
- The center of the screen is occupied by the annotation interface. Your dataset is displayed here and users can add annotations or add/edit the segmentation. Most interactions will take place here.
- The right-hand side of the screen is occupied by several tabs providing more information on your current dataset or annotation. Depending on your editing mode these tabs might adapt.
Read More About Skeleton Annotation Read More About Volume Annotation
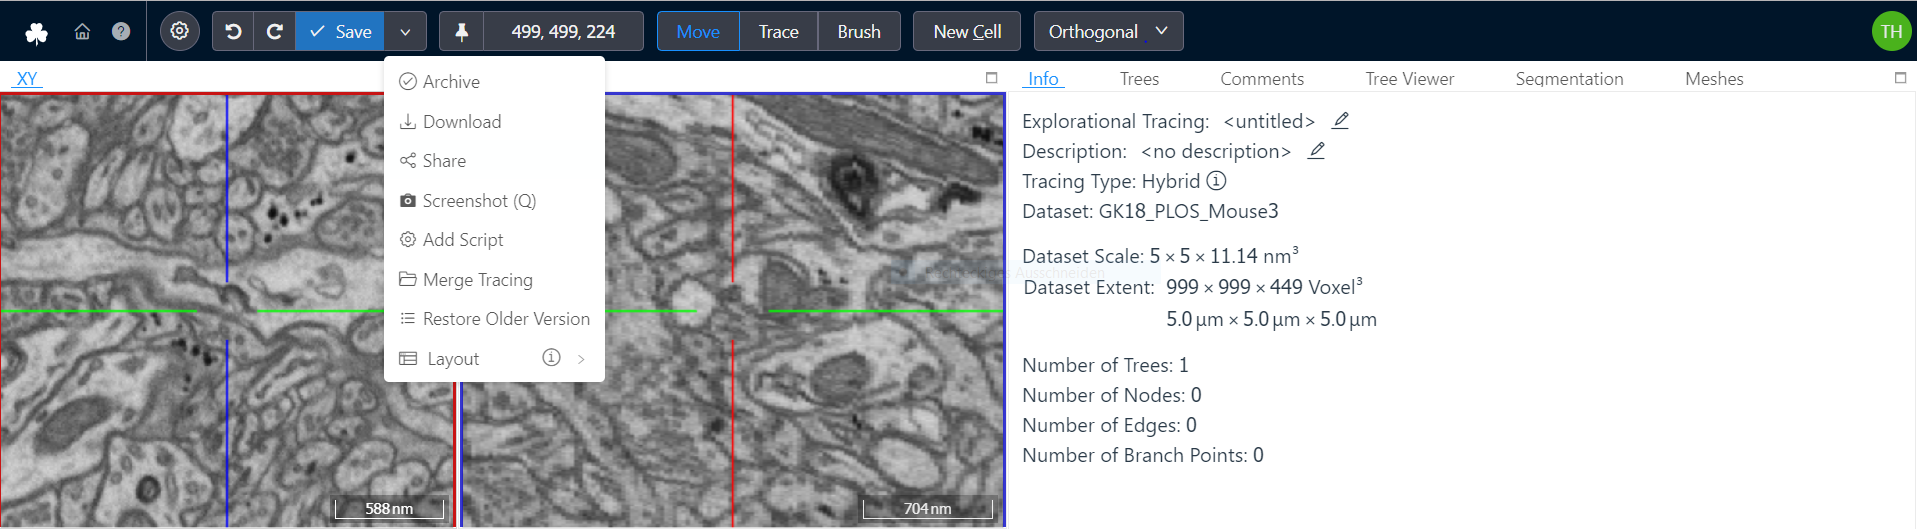
The Toolbar
The toolbar contains frequently used commands, your current position within the dataset and the ability to switch between various modes for viewing and interaction with the dataset or tools depending on your annotation mode.
The most common buttons are:
- Settings: Toggles the visibility of the setting menu on the left-hand side to provide more space for your data.
- Undo / Redo: Undoes the last operation or redoes it if no new changes have been made in the meantime. Undo can only revert changes made in this session (since the moment the annotation view was opened). To revert to older versions use the "Restore Older Version" functionality, described later in this list.
- Save: Saves your annotation work. webKnossos automatically saves every 30 seconds.
- Archive: Only available for Explorative Annotations. Closes the annotation and archives it, removing it from a user's dashboard. Archived annotations can be found on a user's dashboard under "Explorative Annotations" and by clicking on "Show Archived Annotations". Use this to declutter your dashboard.
- Download: Starts the download of the current annotation. Skeleton annotations are downloaded as NML files. Volume annotation downloads contain the raw segmentation data as WKW files.
- Share: Create a shareable link to your dataset containing the current position, rotation, zoom level etc. Use this to collaboratively work with colleagues. Read more about this feature in the Sharing guide.
- Add Script: Using the webKnossos frontend API users can interact with webKnossos programmatically. User scripts can be executed from here. Admins can add often used scripts to webKnossos to make them available to all users for easy access.
- Restore Older Version: Opens a view that shows all previous versions of an annotation. From this view, any older version can be selected, previewed, and restored.
A user can directly jump to positions within their datasets by entering them in the position input field. The same is true for the rotation in some annotation modes. Clicking on the position or rotation labels copies the values to the clipboard.
Annotation UI Settings
The settings menu allows users to fine-tune some parameters of webKnossos.
All settings are automatically saved as part of a user's profile.
The Annotation settings include options related to interacting with a dataset while annotating, e.g. mouse movement speed.
Annotation settings only affect the currently open annotation and will be restored when reopening the respective annotation in the future.
The Dataset settings include options to adjust the rendering of the dataset, e.g. brightness & contrast.
Dataset settings affect all of the user's annotations referencing this particular dataset so that annotations can be created using the same conditions.
Not all settings are available in every annotation mode.
Annotation Settings
Controls
-
Keyboard delay (ms): The initial delay before an operation will be executed when pressing a keyboard shortcut. A low value will immediately execute a keyboard's associated operation, whereas a high value will delay the execution of an operation. This is useful for preventing an operation being called multiple times when rapidly pressing a key in short succession, e.g. for movement. -
Move Value (nm/s): A high value will speed up movement through the dataset, e.g. when holding down the spacebar. Vice-versa, a low value will slow down the movement allowing for more precision. This setting is especially useful inFlight mode. -
d/f-Switching: If d/f switching is disabled, moving through the dataset withfwill always go forward by increasing the coordinate orthogonal to the current slice. Correspondingly,dwill backwards by decreasing that coordinate. However, if d/f is enabled, the meaning of "forward" and "backward" will change depending on how you create nodes. For example, when a node is placed at z == 100 and afterwards another node is created at z == 90, z will be decreased when going forward.
Viewport Options / Flight Options
Zoom: The zoom factor for viewing the dataset. A low value moves the camera really close to the data, showing many details. A high value, will you show more of the dataset but with fewer details and is great for getting an overview or moving around quickly.Viewport Scale: Increases / Decreases the size of dataset viewports in the center of the screen.Clipping Distance: The distance between 3D structures and the camera used for hiding ("clipping") structures. Use it to reduce the number of visible nodes in the viewports and declutter your screen.Show Crosshairs: Shows / Hides the crosshair overlay over the viewports.Mouse Rotation: Increases / Decreases the movement speed when using the mouse to rotate within the datasets. A low value rotates the camera slower for more precise movements. A high value rotates the camera quicker for greater agility.Keyboard Rotation: Increases / Decreases the movement speed when using the arrow keys on the keyboard to rotate within the datasets. A low value rotates the camera slower for more precise movements. A high value rotates the camera quicker for greater agility.Crosshair Size: Controls the size of the crosshair in flight mode.Sphere Radius: In flight mode, the data is projected on the inside of a sphere with the camera located at the center of the sphere. This option influences the radius of said sphere flattening / rounding the projected viewport. A high value will cause less curvature showing the detail with more detail and less distortion. A low value will show more data along the edges of the viewport.
Nodes & Trees
Active Node ID: Contains the active node's ID. Enter a valid node ID to quickly navigate to it within the dataset and set it active for future operations.Active Tree ID: Contains the active tree's ID. Enter a valid tree ID to quickly navigate to the last node of the tree and set it active for future operations.Node Radius: Controls the size of each individual node. Large values will create big nodes, small values create tiny nodes. Each node can have a different size. This is useful for annotations where node sizes have a meaning.Particle Size: Controls the minimum node size for all nodes. This will override nodes with a too small node radius.Override Node Radius: When toggled, overrides all individual node sizes. This allows to uniformly adjust the size of all nodes simultaneously.Soma Clicking: When active every mouse click (Left Click), will create a new tree. Use this for annotations were highlighting/marking structures is more important than labeling connected structures, e.g. for marking all Somas in a dataset.Highlight Commented Nodes: When active, nodes that have a comment associated with them will be rendered with a slight board around them. This is useful for quickly identifying (important) nodes.
Volume Options
Brush Size: The current size of the brush drawing tool.Active Cell ID: Contains the active cell's ID. Enter a valid cell ID to label voxels with this cell ID.
Other
Bounding Box: Users can create custom bounding boxes that will be displayed in all viewports. Useful for orientation when working in specific areas of a dataset. Format: minX, minY, minZ, width, height, depthDisplay Planes in 3D View: Toggles the visibility of the data layers in the 3D viewport. This is useful if you want to view your nodes or a large skeleton in the 3D view without them being covered by the data layers.
Dataset Settings
For multi-layer datasets, each layer can be adjusted separately.
Histogram
The Histogram displays sampled color values of the dataset on a logarithmic scale. The slider below the Histogram can be used to adjust the dynamic range of the displayed values. In order to increase the contrast of data, reduce the dynamic range. To decrease the contrast, widen the range. In order to increase the brightness, move the range to the left. To decrease the brightness, move the range to the right.
Colors
Opacity: Increase / Decrease the opacity of the data layer.Color: Every data layer can be colored to make them easily identifiable. By default, all layers have a white overlay, showing the true, raw black & white data.Visibility: Use the eye icon on the right side of the name of the data layer to enable/disable this layer. If you hold CTRL while toggling the visibility of a layer, that layer will be made exclusively visible.
Segmentation
Segmentation Opacity: Increases / Decreases the opacity of the segmentation layer. A low value will make the segmentation almost transparent letting you see the underlying data layers more clearly. A high value will make the segmentation opaque which is useful for adjusting and reviewing the exact fit of the segmentation layer. Only possible if your dataset has a segmentation layer.Highlight Hovered Cells: Toggles whether segmented cells will be highlighted in all viewports when hovering over them with the mouse cursor. Useful for identifying the highlighted cell in across all viewports.Render Isosurfaces: When activated, isosurfaces are rendered in the 3D viewport when clicking on a cell with Shift+Click. See here for more information.
Quality
Hardware Utilization: Adjusts the quality level used for rendering data. Changing this setting influences how many data is downloaded from the server as well as how much pressure is put on the user's graphics card. Tune this value to your network connection and hardware power. After changing the setting, the page has to be refreshed.Loading Strategy: You can choose between two different loading strategies. When using "best quality first" it will take a bit longer until you see data, because the highest quality is loaded. Alternatively, "Progressive quality" can be chosen which will improve the quality progressively while loading. As a result, initial data will be visible faster, but it will take more time until the best quality is shown.4 Bit: Toggles data download from the server using only 4 Bit instead of 8 Bit for each pixel. Use this to reduce the amount of necessary internet bandwidth for webKnossos. Useful for showcasing data on the go over cellular networks, e.g 3G.Interpolation: When interpolation is enabled, bilinear filtering is applied while rendering pixels between two voxels. As a result, data may look "smoother" (or blurry when being zoomed in very far). Without interpolation, data may look more "crisp" (or pixelated when being zomed in very far).Render Missing Data Black: If a dataset doesn't contain data at a specific position, webKnossos can either render "black" at that position or it can try to render data from another magnification.